Satisfying energy needs throughout the country and ensuring security of electricity supply significantly contributes to Poland’s economic growth, which is reflected in increased income and life qualify of Poles. Such impact of PSE on economic growth is possible owing to the company’s cooperation with numerous enterprises.
As a contributor of taxes and other levies, we have a positive impact on the local, regional and national budgets, enabling many significant projects to be financed.
Stable operation of the Polish Power System
- 45,939 MW
Combined installed capacity w the PPS in 2018
- 45,650 MW
Maximum capacity in the PPS in 2018.
- 26,448 MW
Maximum power demand in the PPS in 2018.
- 165,214 GWh
National gross electricity production in 2018, which represents a decrease of 0.38 percent compared with 2017.
- 170,932 GWh
National consumption of electricity in 2018, which represents an increase of 1.66 percent compared with 2017.
- 98,118.45 GWh
Quantity of electricity supplied from the transmission network to domestic transmission service customers in 2018, including:
- 95,100,95 GWh
of energy supplied to DSOs,
- 3,017.50 GWh
of energy supplied to final consumers.
- 95,100,95 GWh
- 264.24 MWh
ENS (Energy Not Supplied by the system
- 99.99%
electricity supply continuity index in 2017-2018. The level of this index confirms the certainty of power supply to all our transmission service customers.
- 45.77 (minutes)
AIT (Average Interruption Time in the system) – 45.77 (minutes). Low levels of both ratios in 2018 testify to a high level of operational reliability of the transmission system and the certainty of supply to consumers connected to our network
- 1.48 %
Transmission loss rate. In 2018 it was the lowest ever.
- 99.90 %
Availability index for transmission facilities (DYSU) in 2018. It reached a high value at reference value of ≥ 97.5 percent; In 2017, it was 99.77 percent.
- PLN 1,810.3 m
Capital expenditure incurred in 2018.
- 147
Number of network infrastructure investment implemented in 2019.
- PLN 12.8 bn
Capital expenditure planned until 2027.
Management of the power system in Poland
GRI 103-1
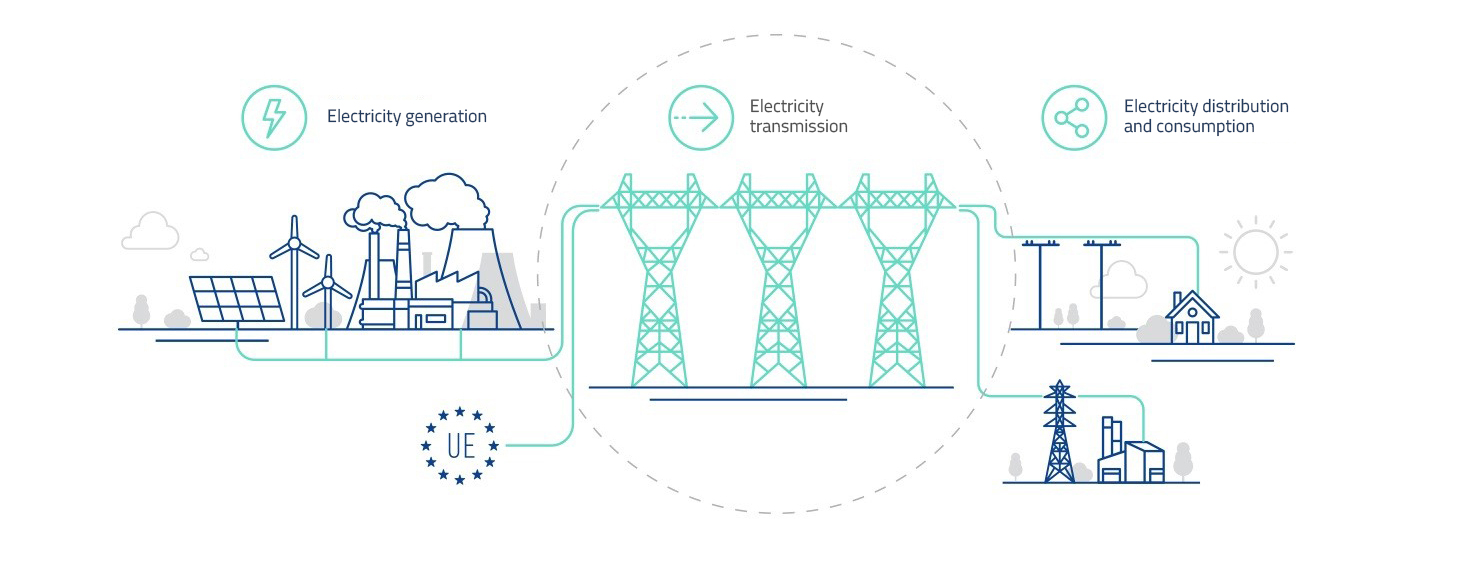
- Electricity generation ─ electric energy production by generating sources in the power system – power plants, CHP plants and distributed sources.
- Electricity transmission ─ performed over the transmission network in order to deliver electric energy to distribution networks or transmission-connected consumers. Electricity transmission is performed by the transmission system operator whose functions are performed by PSE.
- Electricity distribution ─ delivery of electric energy over distribution networks to institutional and individual distribution-connected consumers. Electricity distribution is performed by distribution system operators.
Power System
- synchronously with the ENTSO-E Continental Europe countries (formerly UCTE),
- with dedicated units of the Dobrotvir power plant in the Ukrainian system,
- non-synchronously with the Swedish system via the DC submarine cable,
- non-synchronously with the Lithuanian system via the back-to-back DC link.
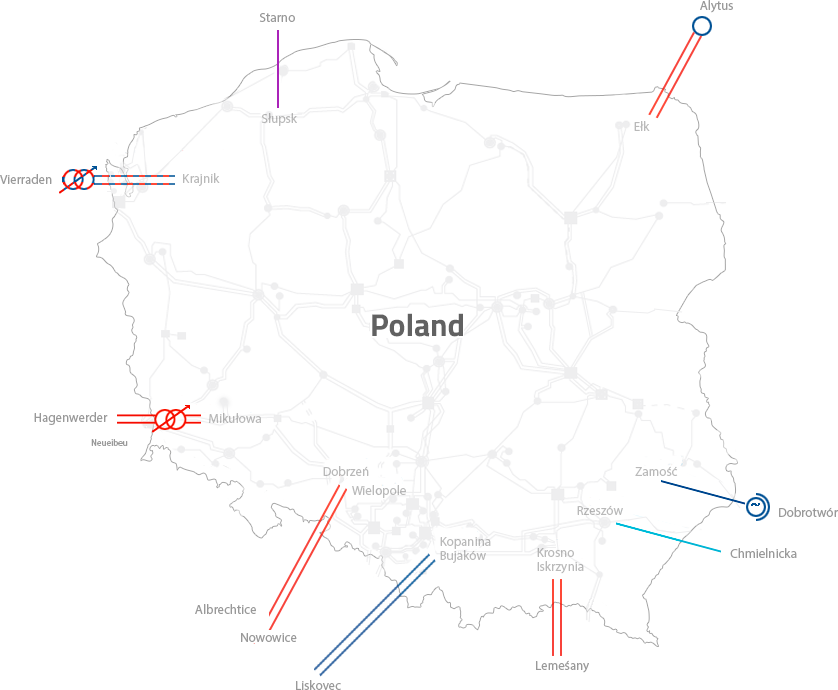
- Krajnik-Vierraden 400 kV double-circuit line – the line in an interim configuration (1 line circuit and 2 serially-connected phase shifters on the German side),
- Mikułowa-Hagenwerder 400 kV double-circuit line with a phase shifter in Mikułowa.
- Wielopole/Dobrzeń-Nosovice/Albrechtice 400 kV double-circuit line,
- Kopanina/Bujaków-Liskovec 220 kV double-circuit line.
- Krosno Iskrzynia-Lemesany 400 kV double-circuit line.
- Słupsk Wierzbięcino-Storno 450 kV DC cable line with a capacity of 600 MW.
- 400 kV double-circuit line interconnected with the Lithuanian system via the back-to-back DC link with a capacity of 500 MW.
- Zamość-Dobrotvir 220 kV single-circuit line operating in coordination with dedicated generating units on the Ukrainian side (the interconnection allows only electricity import to Poland).
- The Rzeszów-Chmielnicka 750 kV single-circuit line is temporarily shut down. Re-commissioning of the line is being considered after the future character of its operation is agreed with the Ukrainian side.
Sweden
Northern border (Poland-Sweden)
Słupsk Wierzbięcino-Storno 450 kV DC cable line with a capacity of 600 MW.
Germany
Western border (Poland-Germany)
Krajnik-Vierraden 400 kV double-circuit line – the line in an interim configuration (1 line circuit and 2 serially-connected phase shifters on the German side),
Mikułowa-Hagenwerder 400 kV double-circuit line with a phase shifter in Mikułowa.
Czech Republic
Southern border (Poland-Czech Republic)
Wielopole/Dobrzeń-Nosovice/Albrechtice 400 kV double-circuit line,
Kopanina/Bujaków-Liskovec 220 kV double-circuit line.
Slovakia
Southern border (Poland-Slovakia)
Krosno Iskrzynia-Lemesany 400 kV double-circuit line.
Ukraine
Eastern border (Poland-Ukraine)
Zamość-Dobrotvir 220 kV single-circuit line operating in coordination with dedicated generating units on the Ukrainian side (the interconnection allows only electricity import to Poland).
The Rzeszów-Chmielnicka 750 kV single-circuit line is temporarily shut down. Re-commissioning of the line is being considered after the future character of its operation is agreed with the Ukrainian side.
Lithuania
Eastern border (Poland-Lithuania)
400 kV double-circuit line interconnected with the Lithuanian system via the back-to-back DC link with a capacity of 500 MW.
Russia
Belarus
750kV
450 kV DC
400kV
220kV

Back-to-back DC tie

Phase shifter

Line being upgraded from 220 kV to 400 kV

Cross-border interconnection being upgraded

Radial line
- transmission system operator ( TSO ) – responsible for operation management of the transmission network and exercises decision-making rights relating to network operation in a coordinated 110 kV network, and relating to security of electricity supply;
- distribution system operator ( DSO ) – responsible for network operation management in the distribution network, for which it is the operator, taking into account the TSO's decision-making rights.
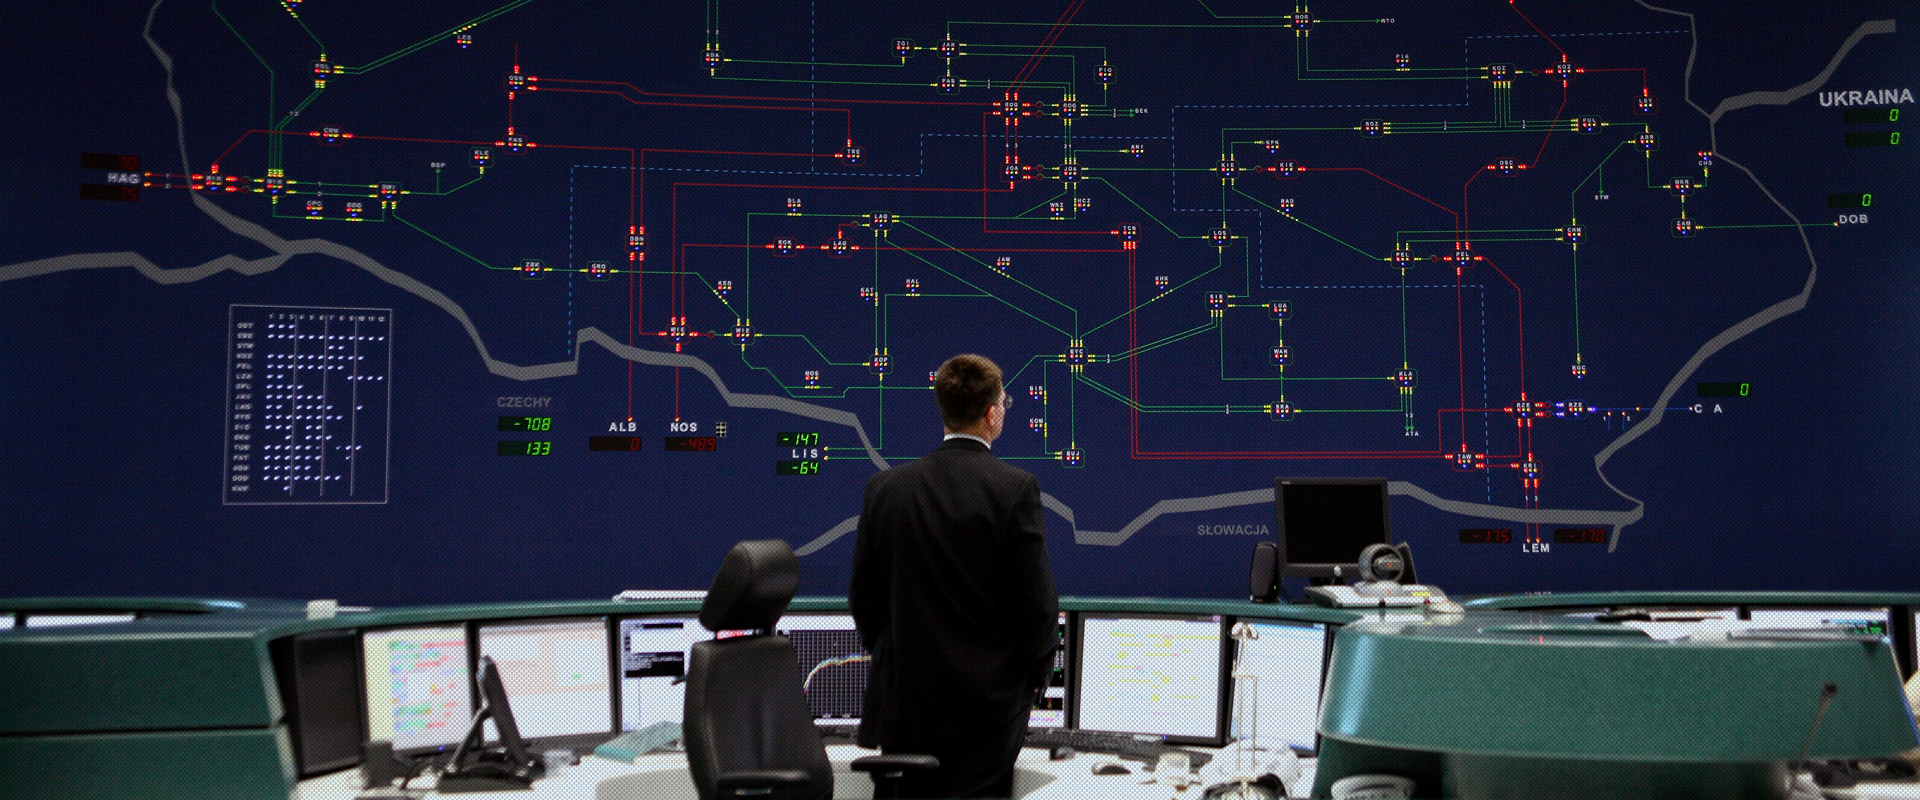
- National Dispatch Centre (Krajowa Dyspozycja Mocy – KDM) – manages the operation of the 750, 400, 220 kV transmission network as well as selected 110 kV lines of system-wide significance,
- Area Dispatch Centre (Obszarowa Dyspozycja Mocy – ODM) – manages the operation of the 750, 400, 220 and 110 kV transmission network and switching operations,
- Central Dispatch Centres (Centralne Dyspozycje Mocy – CDMs), Branch Dispatch Centres (Oddziałowe Centra Dyspozytorskie – OCDs) – manage the operation of the 110 kV distribution network and switching operations in the 110 kV and lower-voltage distribution network.
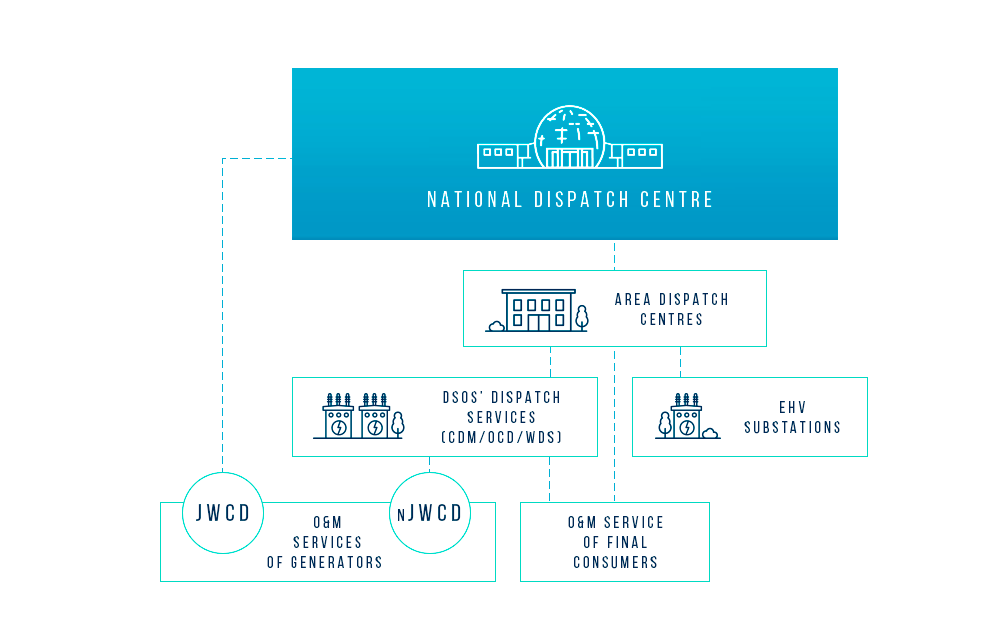
GRI 103-2
- annual plans – for a period of up to 3 years,
- monthly plans,
- daily planning processes including:
- preliminary daily plans,
- daily plans,
- current daily plans,
- daily technical-trading balances.
- available capacity of generation units which are not centrally dispatched,
- additional capacity of power plants operating in overload, i.e. at a capacity higher than nominal (providing ancillary services),
- intervention power supply from pumped storage plants which allow power demand to be balanced (as part of ancillary services) within a short period (2-4 hours),
- dispatch electricity exchange with the neighbouring TSOs,
- cold intervention reserve,
- reduction of demand on instructions from the TSO, i.e. the Demand Sie Response (DSR) service.
Activities promoting dependable operation of the transmission system
- Regulation ancillary services (RAS):
- operating cold reserve,
- share in primary control,
- share in secondary control,
- underload or overload operation,
- participation in automatic voltage and reactive power control,
- The Generating Unit activation service (activation service).
- Regulation ancillary services involving the intervention reserve:
- contingency operation,
- intervention cold reserve.
- reduction of demand on instructions from the TSO,
- nJWCD reliability-must-run service (RMR service).
- Polish Power System restoration service.
Learn more about DSR Intervention Programs
Security and continuity of supply
Performance for key system operation dependability indicators


ENS and AIT indicators for all outages (planned and emergency)*

Electricity supply continuity index*
- Development of long- and short-term network operation coordination plans. Time schedules of both maintenance work and repair work on network elements and generating units so as to ensure the maintenance of surplus power levels required in a given period, available in excess of forecasted demand, and to ensure compliance with the required secure network operation criteria, including the reliability criterion (n-1).
- Development and implementation of a single maintenance model that allows the state of repair of equipment and its operational environment to be evaluated in a cyclic, standardised and measurable manner. Owing to those activities, the most depreciated and oldest grid assets – the potential source of emergency and fault conditions – are preventively replaced.
- Implementation of the maintenance personnel development programme. It supports continuous competence building of the company's own maintenance personnel, including field personnel.
- Undertaking investment activities. Optimises the loading of transmission lines and eliminates overloads of transmission system elements.
- Systematic standardisation of network equipment and creation of storage facilities. Supports quick and cost-effective necessary replacements.
- Close cooperation and making arrangements with transmission service customers at each stage, i.e. from planning to execution.

Electric energy losses in the transmission process, showing loss causes
(e.g. illegal consumption of electricity)
of total energy fed into the system
(G.10.7 official data)*
Development of the transmission system
Improving the new infrastructure investment implementation model
- The increasing share of unstable sources in the Polish energy mix complicates the transmission network management process.
- The Polish power system stands at the threshold of a potential revolution in the automotive industry, which may lead to a significant increase in energy demand.
- Historical centres of electricity supply and demand are shifting due to the support being given to distributed sources.
- agreements have been signed with contractors,
- the public contract notice has been published,
- the contract award decision has been made.
Power evacuation from Kozienice Power Plant including the improvement of power supply conditions in north-eastern Poland 11 projects, PLN 573.2 m of total contracted budget as at 30 August 2019.
Power evacuation from Turów Power Plant including the improvement of power supply conditions in south-western Poland 16 projects, PLN 711.6 m of total contracted budget as at 30 June 2019.
Power evacuation from Dolna Odra Power Plant and RES including the improvement of power supply conditions in north-eastern Poland: 22 projects, PLN 1,086.7 m of total contracted budget as at 30 June 2019.
Power evacuation from RES including the improvement of power supply conditions in northern Poland: 14 projects, PLN 2,139.4 m of total contracted budget as at 30 June 2019.
Power evacuation from Bełchatów Power Plant including the improvement of power supply conditions in central Poland: 9 projects, PLN 133, 05 m of total contracted budget as at 9 August 2019.
Strategic programme “Construction of Submarine Interconnectors and Energy Storage Facilities”: 2 projects that have not yet been contracted.
Area Programme North: 31 projects, PLN 1,338.2 m of total contracted budget as at 30 August 2019.
Regional Programme South: 30 projects, PLN 1,028.9 m of total contracted budget as at 30 August 2019.
Formal completion of investment projects: 12 projects, PLN 2,789.9 m total contracted budget as at 30 June 2019.

Key figures
147
projects
under strategic and area programmes
9.81
PLN bn
total contracted budget for projects under the Network Investment Portfolio
26
contractors
for construction and erection works, supplies and services
Stages of network investment preparation

What do we need?
Preparation of an investment plan based on power requirements and connection applications.

Technical parameters
Definition of the technical parameters of expected outcomes and the area covered.

Preparation of preliminary variants
Preparation of preliminary variants of project implementation. Consultations with commune authorities.

Consultation and information process
Meetings for residents of communes and villages, collecting opinions of local communities.

Optimum route selection
Making adjustments and selecting the optimum route having regard to social, environmental, technical and economic considerations.

Detailed planning
Adoption of a detailed route plan and implementation variant.

Obtaining the right to use land
Negotiations with property owners in order to acquire land for substations or transmission easement for a line.

Incorporation in commune planning
Incorporation in local planning, unless already made, or obtaining a decision on the location of a public utility project.

Environmental report
Submission of the environmental impact report and obtaining the decision on environmental conditions.

Building permit
Obtaining the building permit.
Tab. 1. Investment projects of key significance for the operation of the transmission system included in the Network Investment Portfolio as at 30 June 2019.
No.
Project title
| No. | Project title |
|---|
| 1 | Construction of the 400 kV Kozienice-Miłosna line |
| 2 | Expansion of the 400/220/110 kV Miłosna substation |
| 1 | Construction of the 400 kV Jasiniec-Grudziądz Węgrowo line |
| 2 | Construction of the 400 kV Pątnów-Jasiniec line |
| 3 | Expansion of the 220/110 kV Jasiniec substation by adding 400 kV switchgear |
| 4 | Expansion of the 400/220/110 kV Pątnów substation together with the 400kV Kromolice - Pątnów line entry |
| 1 | Construction of the Gdańsk Przyjaźń-Żydowo Kierzkowo 400 kV line |
| 2 | Construction of the 400 kV Żydowo Kierzkowo-Słupsk line |
| 3 | Construction of the Żydowo Kierzkowo 400/110 kV substation including 220/110 kV transformer installation |
| 4 | Construction of the Gdańsk Przyjaźń 400/110 kV substation including the entry of one circuit of the Gdańsk Błonia-Żarnowiec 400 kV line |
| 1 | Replacement of existing autotransformer at the 220/110kV Kopanina substation with 275 MVA units |
| 2 | Installation of second autotransformer at the 220/110 kV Siersza substation |
| 1 | Construction of the 400 kV Mikułowa-Czarna line |
| 2 | Construction of the 400 kV Czarna-Pasikurowice line |
| 3 | Expansion of the 400/220/110 kV Mikułowa substation for 400kV line entry |
| 4 | Expansion of the 400/110 kV Pasikurowice substation in connection with the 400kV line entry and replacement of 400/110kV transformer |
| 1 | Construction of the 400 kV Baczyna-Krajnik line |
| 2 | Expansion of the 400/220/110 kV Plewiska substation in connection with the 400 kV line entry and installation of reactive compensation equipment |
| 3 | Construction of the 400 kV Baczyna-Plewiska line |
| 4 | Construction of the 400/110 kV Baczyna substation together with the 400 kV Krajnik-Plewiska line entry |
| 5 | Expansion of the 400/110 kV Baczyna substation in connection with the 400 kV Baczyna-Plewiska line entry and installation of reactive compensation devices |
| 1 | Construction of the 400 kV line including change of the EHV network configuration between Warsaw agglomeration and Siedlce |
| 2 | Construction of the 220/110 kV Praga (Żerań) substation including the 220 kV Miłosna-Mory line entry |
| 3 | Construction of the 400 kV Ostrołęka-Stanisławów line together with expansion of the 400 kV Stanisławów substation and 400/220/110 kV Ostrołęka substation including 400(220)/110 kV Wyszków substation entry |
| 4 | Suspension of the second 400 kV circuit of the Ostrów-Kromolice line |
| 5 | Construction of the Poland-Lithuania HVDC cable interconnector |
- 4 public procedures for construction works, which ended with entering into a contract with the selected contractor:
- Construction of the 400/110 kV Baczyna substation
- Construction of the 400 kV Baczyna-Plewiska power line
- Construction of the 400 kV including change of EHV network configuration between Warsaw agglomeration and Siedlce
- Construction of the 400 kV Ostrołęka-Stanisławów line including expansion of the 400 kV Stanisławów substation and the 400/220/110 kV Ostrołęka substation - Stage II
- 7 public procedures for construction works, which ended with entering into a contract with a contractor:
- Upgrade of the 220 kV Kielce-Rożki line,
- Expansion of the (400)/220/110 kV Skawina substation for connection of Unit 3 at Skawina Power Plant,
- Upgrade of the 220 kV Janów-Zgierz-Adamów line – Stage I,
- Upgrade of the 220 kV Janów-Rogowiec, Rogowiec-Piotrków line.
We have adopted strategic and area programmes and select a package of investment projects for them to ensure the effective performance of strategic objectives based on sustainable development of the national transmission system. In doing so, we take into account the current conditions – especially system and formal/legal conditions of project implementation.
| Description | Expenditure (in PLN m) | ||
|---|---|---|---|
| 2018 | 2017 | 2016 | |
| ICT | 45,8 | 33,9 | 37,3 |
| Construction and expansion of power lines and substations | 1 728,3 | 1 250,8 | 1 024,3 |
| Upgrade of substations and power lines | 150,2 | 136,5 | |
| Buildings and structures | 3,6 | 1,4 | 1,8 |
| Purchase of finished capital goods | 8,1 | 7,3 | 4,4 |
| Investment preparation / investment proposals for conditional or later implementation | 0,9 | 9,7 | 8,9 |
| Purchase of grid assets | 0,1 | 0,6 | 3,7 |
| Provision | 23,5 | 6,5 | - |
| Total | 1 810,3 | 1 460,4 | 1 216,9 |
total capital expenditure incurred for the implementation of investment projects and proposals in 2018.
Maintaining the transmission network
| GRI EU4 Length and number of underground power transmission lines | |||||
|---|---|---|---|---|---|
| 2018 | 2017 | ||||
| Voltage | Length (in km) converted to 1 circuit |
Number | Voltage | Length (in km) converted to 1 circuit |
Number |
| 750 kV | 114 km | 1 | 750 kV | 114 km | 1 |
| 400 kV | 6 826 km | 102 | 400 kV | 6 326 km | 93 |
| 220 kV | 7 755 km | 164 | 220 kV | 7 755 km | 164 |
| 110 kV | 75 km | 34 | 110 kV | 71 km | 32 |
| GRI EU4 Length and number of underground power transmission lines | |||||
|---|---|---|---|---|---|
| 2018 | 2017 | ||||
| Voltage | Length (in km) converted to 1 circuit |
Number | Voltage | Length (in km) converted to 1 circuit |
Number |
| 450 kV DC | submarine 450 kV DC Poland- Sweden link with a total length of 254 km (of which 127 km belongs to PSE) | 1 | 450 kV DC | submarine 450 kV DC Poland- Sweden link with a total length of 254 km (of which 127 km belongs to PSE) | 1 |
| Transformation ratio in kV/kV | Transformers in 2018 | Transformers in 2017 | |||
|---|---|---|---|---|---|
| Number (units) | Capacity (MVA) | Capacity (MVA) | |||
| 750/400 | installed | 2 | 2 502 | 2 | 2 502 |
| spare inventory | - | - | - | - | |
| 400/220 | installed | 30 | 16 790 | 29 | 16 120 |
| spare inventory | - | - | - | - | |
| 400/110 | installed | 52 | 16 578 | 54 | 17 078 |
| spare inventory | 3 | 736 | 1 | 236 | |
| 220/110 | installed | 120 | 20 450 | 121 | 20 335 |
| spare inventory | 3 | 480 | 2 | 320 | |
| Total | installed | 204 | 56 320 | 206 | 56 035 |
| spare inventory | 6 | 1 216 | 3 | 556 | |
|
In-house indicator
Transmission equipment availability factor – DYSU (in percent) |
Jan-Dec 2018 [%] |
Jan-Dec 2017 [%] |
Jan-Dec 2016 [%] |
Reference value of the transmission equipment availability factor (internal calc.) [%] |
|---|---|---|---|---|
| Category L1 transmission line availability factor [DL1] | 99,97 | 99,77 | 99,64 | |
| Category L2 transmission line availability factor [DL2] | 99,92 | 99,58 | 99,63 | |
| Generator outgoing line availability factor [DLB] | 100,00 | 99,99 | 99,99 | |
| Transformer availability factor for Category S11 substations [DS11] | 99,85 | 99,85 | 99,85 | |
| Transformer availability factor for Category S22 substations [DS22] | 99,76 | 99,67 | 99,59 | |
| DYSU | 99,90 | 99,77 | 99,74 | ≥ 97,5 |
| PSE’s grid assets are situated on real properties with the following legal status: | Area (in m2) |
|---|---|
| Ownership | 2 531 725 |
| Joint ownership | 4 489 |
| Perpetual usufruct right | 5 403 597 |
| Share in perpetual usufruct | 4 399,50 |
| Right of possession | 881 |
| Total | 7 945 091,50 |
| Information and communication technology (ICT) assets (forming part of the network infrastructure) |
Number |
|---|---|
| Fibre optic and telecommunication lines (including optical fibres as components of power lines) | 476 |
| IT hardware | 12 079 |
| Signal transmission and telecommunication devices | 3 627 |
| Devices forming part of power supply systems and air-conditioning systems and measuring instruments. | 1 600 |
| Licences, copyrights and proprietary rights | 2 740 |
GRI 103-2

Key figures
123 415,7
PLN k
Costs incurred for maintenance and repair tasks in 2018, including:
98 768,7
PLN k
Maintenance of grid assets
24 647
PLN k
Repair projects
