

CEO Letter
Ladies and Gentlemen,
I have the honour to present the latest Report on the impact of the activities of Polskie Sieci Elektroenergetyczne on the economic, environmental and social development of the country. It is the fifth social report of our organisation, the second impact report of PSE and the only such document in the Polish energy industry.
More
Eryk Kłossowski
President of the Management Board
Polskie Sieci Elektroenergetyczne

PLN 6.73 bn
of added value
for the Polish economy
17.5 k
retained jobs in domestic market
PLN 1.17 bn
total amount of taxes, fees and contributions paid by PSE to the state budget and local government budgets.


CEO Letter
Ladies and Gentlemen,
I have the honour to present the latest Report on the impact of the activities of Polskie Sieci Elektroenergetyczne on the economic, environmental and social development of the country. It is the fifth social report of our organisation, the second impact report of PSE and the only such document in the Polish energy industry.
MoreEryk Kłossowski
Prezes Zarządu
Polskich Sieci Elektroenergetycznych S.A.
PLN 6.73 bn
of added value
for the Polish economy
17.5 k
retained jobs in domestic market
PLN 1.17 bn
total amount of taxes, fees and contributions paid by PSE to the state budget and local government budgets.
Learn about our economic impact
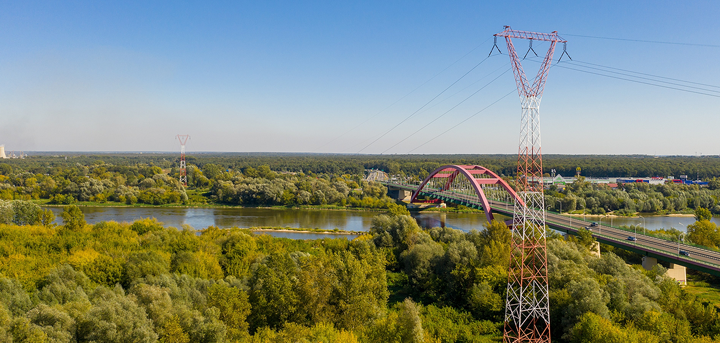
- Security and continuity of supply
- Improving the new infrastructure investment implementation model
- Strengthening innovation and implementing new technologies
- Supporting the government administration in the notification of the Polish capacity market mechanism to the European Commission
- Participation in the SIDC international project leading to the implementation of single intraday coupling at EU level
- Development of diagnosis titled ‘European Electricity Market’
- Development of DSR IP services and contracting reduction capacity
- PSE CG Cybersecurity Programme

Learn about our social impact
- Quality of Poles’ lives vs electricity supply
- How PSE’s activities translate into the transmission tariff and electricity bills
- Impact on local communities
- National grant scheme ‘Empower your environment’
- Management of the area of ethics and anti-corruption
- Work based on the highest standards of safety

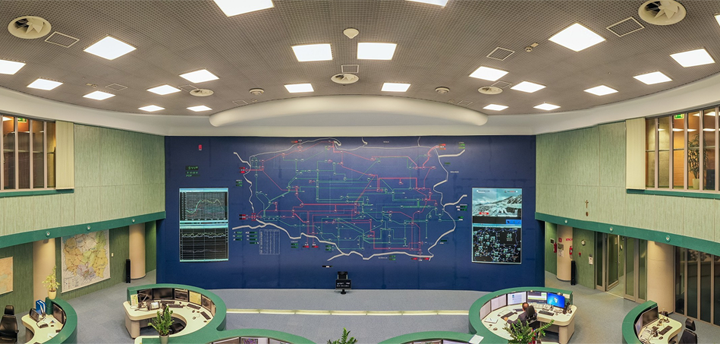
PPS operation data
45,939 MW
Combined installed capacity w the PPS in 2018.
45,650 MW
Maximum capacity in the PPS in 2018.
26,448 MW
Maximum power demand in the PPS in 2018.
142,029 GWh
Total electricity consumption by final consumers connected to the PPS in 2018.
98,118.45 GWh
Quantity of electricity supplied from the transmission network to domestic transmission service customers in 2018.

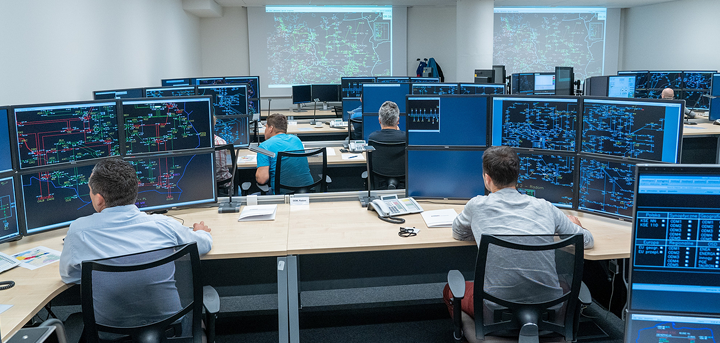
System operation dependability indicators
1.48 %
Transmission loss rate. In 2018 it was the lowest ever.
99.99 %
Electricity supply continuity index in 2018. Its level confirms the certainty of power supply to all transmission service customers.
99.90 %
Availability index for transmission facilities (DYSU) in 2018. It reached a high value at reference value of ≥ 97.5 percent; In 2017, it was 99.77 percent.
Forecast and R&D
184.4 TWh
This is the electricity demand in Poland in 2027 according to a high forecast.
15.2 m ZŁ
Estimated value of R&D projects conducted at PSE involving operational security analyses of the Polish power system.